Skip to content
flexEngage
  • Products
    • All Products
    • Digital Receipts
    • Printed Offers
  • Customers
  • Downloads
  • Videos
Get a Sample
Header form
shopping-606993_1280

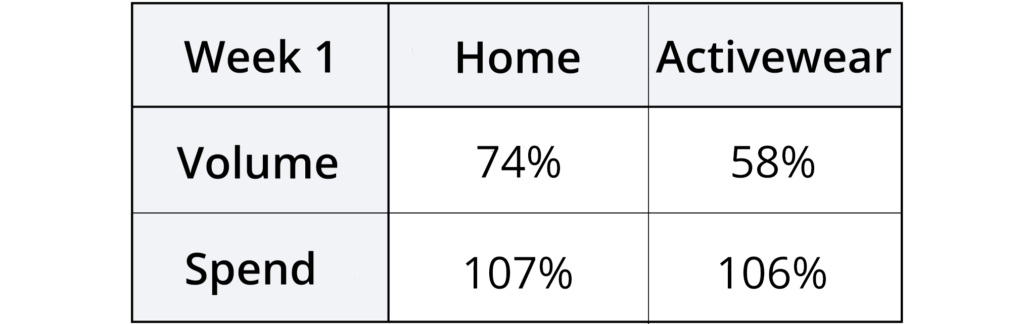
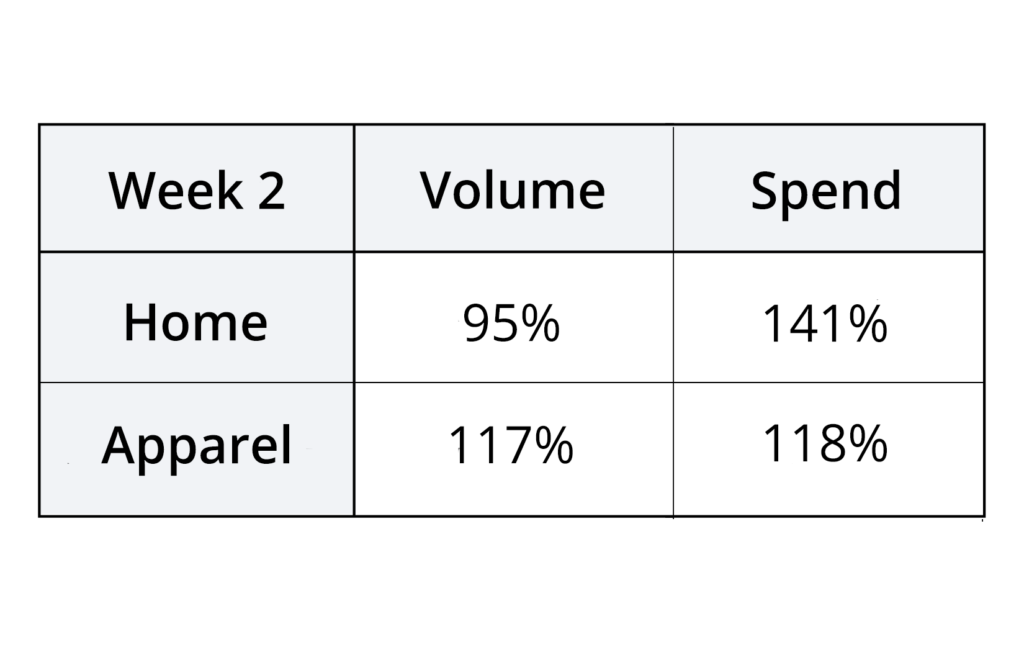
STIMULUS SPENDING RECAP

During the past year, we’ve seen some changes in the way consumers spend. From increased AOV and making less purchases in stores, consumer shopping behavior is changing as consumers adjust to the ever-changing normal. The announcement for the second stimulus had many wondering how consumers will spend their dollars as life reopens and the weather warms. We’ve taken a look into the transaction data of retailers to see how, or whether consumers spent these extra dollars. 

-WEEK 1: WEEK OF ANNOUNCEMENT-

26%

INCREASE IN SPEND

Spend Increased, Transactions Maintained

As the stimulus was announced through the first day of distribution, spending rose by 26%. The volume of transactions did not rise, however, falling by only -0.18%. This indicates that there was an increase in purchase size, and many consumers were not pre-spending in anticipation of their stimulus payments. 

– WEEK 1: WEEK OF ANNOUNCEMENT-

26%

INCREASE IN SPEND

Spend Increased, Transactions Maintained

As the stimulus was announced through the first day of distribution, spending rose by 26%. The volume of transactions did not rise, however, falling by only -0.18%. This indicates that there was an increase in purchase size, and many consumers were not pre-spending in anticipation of their stimulus payments. 

-WEEK 1: WEEK OF ANNOUNCEMENT-

Home & Activewear Saw the Most Growth

During week one, purchases from home brands increased by 74%, and spend increased by 107%. Activewear brand purchases increased by 58% and spending by 106%. All categories of retailers saw growth in spending except luggage and health & wellness brands. 

-WEEK 2: PAYMENTS HITTING ACCOUNTS-

71%

INCREASE IN SPEND

As Payments Hit Accounts, Transaction Volume & Spend Rise

Transaction volume increased by 24% this week with spend increasing by 71%. Similar to the prior week, all categories of retailers saw growth excluding health & wellness and luggage. 

-WEEK 2: PAYMENTS HITTING ACCOUNTS-

Home and Activewear brands saw the most growth ​

Echoing previous findings, consumers continue to invest in home-related purchases by 124%. This is followed by apparel brands, which increased by 118%. Similar to the findings above, health & wellness and luggage were the only categories of retailers who saw a decline. 

-WEEK 2: PAYMENTS HITTING ACCOUNTS-

Home and Activewear brands saw the most growth ​​

Echoing previous findings, consumers continue to invest in home-related purchases by 124%. This is followed by apparel brands, which increased by 118%. Similar to the findings above, health & wellness and luggage were the only categories of retailers who saw a decline. 

-RECAP-

TRANSACTION VOLUME CLIMBED AS SPENDING CLIMBS EVEN MORE

During this two-week period, transaction volume climbed by 11%, and spending climbed even more by 47%. Most categories of retailers who saw an increase saw growth of over 60% in spend. This increase, in proportion to the transaction volume, indicates that the trend of larger shopping trips is still continuing.  As we look forward to the coming months, spend for retailers is not only recovering but thriving. This means that as consumers become more willing to enter stores again, retailers need to focus on continuing to use their digital channels to drive their consumers back into their stores and not their competitors. 

ABOUT THE DATA

icon (8)

flexEngage

Aggregating the data of over 70 retailers since launch and over 12,000 stores, flexEngage turns purchase data into meaningful engagement for brands. 


This data compares year-over-year performance for in-store sales for the following dates: LY Week 1, March 14th to March 20th, 2019; LY Week 2, March 21st to March 27th, 20219; CY Week 1, March 11th to March 17th, 2021; and, CY Week 2, March 18th to March 24th, 2021. Due to the closures in 2020, 2019 data was selected to show more accurate trends for growth or decline with the reopenings of stores. 

Linkedin

Get Our Newsletter for More Purchase Data Insights

Subscribe to our newsletter to get more insights like this, find out what you can do post-purchase to help your customers engage with you and more. 

  • Sitemap
  • Privacy Policy
  • Terms of Use
  • Subprocessors
  • Status

Copyright 2024