Skip to content
flexEngage
  • Products
    • All Products
    • Digital Receipts
    • Printed Offers
    • Order Status Messages
    • Order Tracking
    • White Glove Support
  • Industries
    • Specialty
    • Grocery
    • Restaurants
    • Convenience Stores
    • Pharmacy
  • Customers
  • Resources
    • All Resources
    • Blog
    • Downloads
    • Videos
  • Company
    • Our Company
    • Partners
    • News
    • Careers
Get a Sample
Header form
jewelry-store-1803808_1280

VALENTINE'S SALES RECAP

Approaching a year into the pandemic, consumers are adjusting their habits and spending into the new way of living for the time being. Valentine’s Day marks one of the last holidays consumers will be experiencing for the first time under this pandemic, causing questions to come out about how consumer shopping has changed with the experience of the winter holidays under their belts. Performance of Valentine’s Day did not parallel that of December’s, with notable spending habits changing. Read on to see what categories saw growth, decline, and how consumers choose to shop.

-JEWELRY-

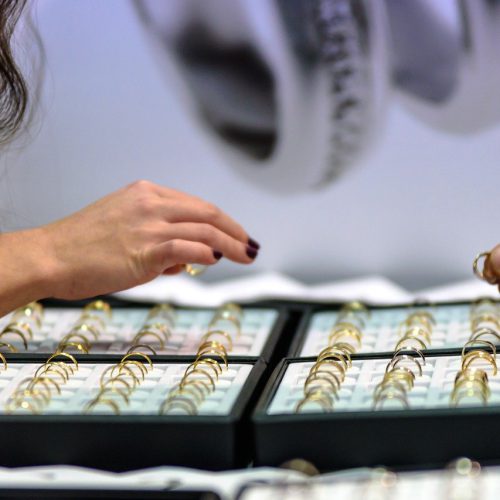
Jewelry AOV Increased

Valentine’s did not boost the sales of jewelers prior, instead of boosting sales post-Valentines Day. Jewelry sales maintained last year’s performance during this two-week window, while total transactions did drop by 16%. The week before Valentine’s Day, sales dropped by 7% and transactions fell by 22%. Sales the following week rose, climbing 22% year over year while transactions continued to fall by 7%. This indicates that people who were shopping were making larger purchases, with a rise in average order value. 

– JEWELRY-

Jewelry AOV Increased​

Valentine’s did not boost the sales of jewelers prior, instead of boosting sales post-Valentines Day. Jewelry sales maintained last year’s performance during this two-week window, while total transactions did drop by 16%. The week before Valentine’s Day, sales dropped by 7% and transactions fell by 22%. Sales the following week rose, climbing 22% year over year while transactions continued to fall by 7%. This indicates that people who were shopping were making larger purchases, with a rise in average order value.

– LUXURY-

Luxury Sales & AOV Increased

Similar to Jewelry, those who shopped purchased more during their trips, with total transactions decreasing by 30% for the two-week period analyzed. Unlike Jewelry, sales climbed 27% year-over-year the week before Valentine’s and maintained last year’s performance the following week, netting out an average 15% increase for this two-week period year-over-year.

-LUXURY-

Luxury Sales & AOV Increased

Similar to Jewelry, those who shopped purchased more during their trips, with total transactions decreasing by 30% for the two-week period analyzed. Unlike Jewelry, sales climbed 27% year-over-year the week before Valentine’s and maintained last year’s performance the following week, netting out an average 15% increase for this two-week period year-over-year.

-APPAREL & FOOTWEAR-

With limited places to go, apparel & footwear sales fall.

With limitations on where to go with capacity restrictions and general safety concerns, apparel and shoes took year-over-year hits in sales for all weeks analyzed. Shoes and apparel both fell around 22% for this period. Transactions dropped similarly, indicating that the AOV did not increase like jewelry or luxury.

-APPAREL & FOOTWEAR-

With limited places to go, apparel & footwear sales fall.​

With limitations on where to go with capacity restrictions and general safety concerns, apparel and shoes took year-over-year hits in sales for all weeks analyzed. Shoes and apparel both fell around 22% for this period. Transactions dropped similarly, indicating that the AOV did not increase like jewelry or luxury.

– GENERAL MERCHANDISE-

General Merchandise Sales Still Climbed

General merchandise sales grew over this two-week period by 18%. Transactions saw a slight boost the week prior to Valentine’s, but fell the following week resulting in a 3% decline year-over-year.

-GENERAL MERCHANDISE-

General Merchandise Sales Still Climbed

General merchandise sales grew over this two-week period by 18%. Transactions saw a slight boost the week prior to Valentine’s, but fell the following week resulting in a 3% decline year-over-year.

-LUGGAGE-

Luggage Sales Decline Could be Due to Travel Regulations & Concerns

Luggage sales fell year-over-year, dropping 45% in sales this year. This expected drop could be because of travel restrictions and limitations, making consumers feel uncomfortable with traveling or having concerns with the repercussions of traveling during this time.

-RECAP-

SALES GROW EVEN AS TRANSACTIONS DECLINE

Apparent across multiple verticals, many retailers saw disproportionate growth of sales to transaction volumes beyond normal inflation numbers. This indicates that the intent of those who are shopping could be higher, raising the AOV for purchases made. This trend does not parallel the way consumers shopped during the Holidays, indicating that shopping during this Holiday is more purposeful, with those who shop willing to spend more during this time period on those they are purchasing for. 

ABOUT THE DATA

icon (8)

flexEngage

Aggregating the data of over 70 retailers since launch and over 12,000 stores, flexEngage turns purchase data into meaningful engagement for brands. 


This data compares year-over-year performance for in-store sales for the Sunday prior to Valentine’s Day through the Sunday following Valentine’s day for a two-week period. The dates ran are as follows: LY Week 1, February 9th to February 15th, 2020; LY Week 2, February 16th to February 22nd, 2020; CY Week 1, February 7th to February 13th, 2021; and, CY Week 2, February 14th to February 20th, 2021. 

Linkedin

Get Our Newsletter for More Purchase Data Insights

Subscribe to our newsletter to get more insights like this, find out what you can do post-purchase to help your customers engage with you and more. 

  • News
  • Blog
  • Customers
  • Company
  • Partners
Footer email capture
  • Sitemap
  • Privacy Policy
  • Terms of Use
  • Subprocessors
  • Status

Copyright 2023

 
FLEXENGAGE IS NOW A PART OF KLARNA - CLICK HERE TO LEARN MORE